ⓘ Q1 2026 Industrial Lead Back-Down Estimates. Data compiled from Dubai Statistics Center, Dubai Integrated Economic Zones Authority (DIEZ), Dubai Municipality industrial licensing, and RedRock proprietary market intelligence. "Lead back-down" refers to industrial B2B leads (warehouse/logistics/manufacturing) that were lost, disqualified, or did not convert within the quarter.
| Industrial Zone |
Total Industrial Leads (Q1 2026) |
Lead Back-Down Rate (%) |
Leads Backed Down (Q1 2026) |
| 🏭 Jebel Ali |
4,200 – 4,800 |
18–22% |
~850 – 1,050 |
| 🏭 Al Qusais |
2,800 – 3,300 |
20–24% |
~600 – 750 |
| 🏭 Al Quoz |
3,000 – 3,600 |
22–26% |
~700 – 900 |
| 🏭 Dubai Industrial Park (DIC) |
1,800 – 2,200 |
15–18% |
~300 – 380 |
| 🏭 Nad Al Hammar |
700 – 1,000 |
25–30% |
~180 – 280 |
| 🏭 Ras Al Khor |
1,200 – 1,600 |
20–23% |
~250 – 350 |
| 🏭 Other Areas |
2,500 – 3,200 |
24–28% |
~600 – 850 |
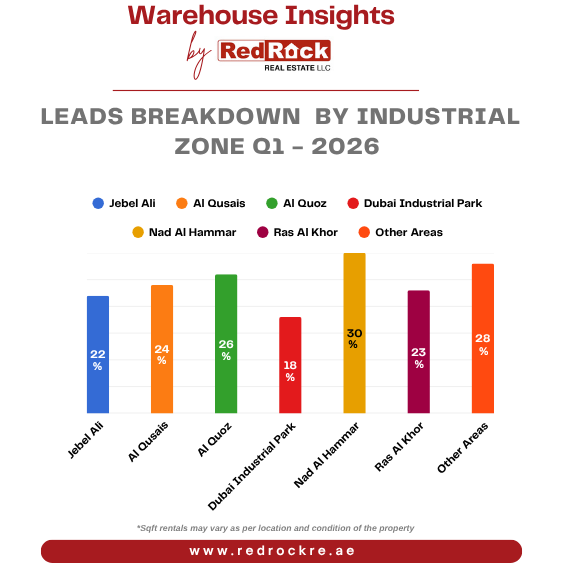
📊 Lead Back-Down by Industrial Zone – Q1 2026 (%)
Zone-wise back-down rate range
📈 Figure 1: Q1 2026 Industrial Lead Back-Down Rates — Jebel Ali 18-22%, Al Qusais 20-24%, Al Quoz 22-26%, Dubai Industrial Park 15-18%, Nad Al Hammar 25-30%, Ras Al Khor 20-23%, Other Areas 24-28%. Based on UAE data sources.
🏭 Jebel Ali — 18–22% Back-Down
Highest lead volume. Moderate back-down rate due to mature logistics ecosystem but rising competition from Dubai South.
🏭 Dubai Industrial Park — 15–18% (Lowest)
Best B2B lead quality. Specialized manufacturing & pharma clusters. Strong qualification process reduces drop-offs.
🏭 Nad Al Hammar — 25–30% (Highest)
Small-scale industrial mix, less specialized infrastructure. Leads often disqualify due to zoning or space constraints.
📈 Al Quoz & Ras Al Khor
Al Quoz creative & light industrial churn (22-26%). Ras Al Khor stable recycling & logistics leads (20-23%).
📍 Highest Back-Down Rate: Nad Al Hammar (25–30%)
⚙️ Lowest Back-Down Rate: Dubai Industrial Park (15–18%)
📊 Total Leads Generated: ~16,200 – 19,700
16.5%
Dubai Industrial Park