Area-wise distribution of office inquiries & demand | UAE Data Sources
| Area / Business District | Office Leads (% of total) — Q1 2026 | Market Position & Key Insights |
|---|---|---|
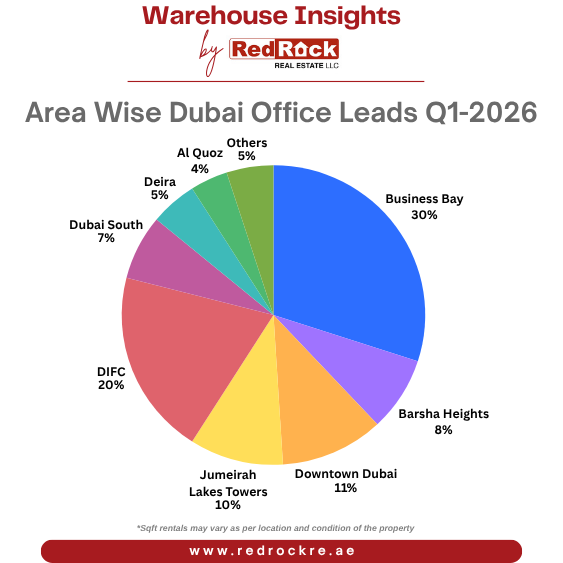
| 📍 Business Bay | 30% | 🏆 Highest lead volume — Central location, flexible office spaces, new Grade A towers, fintech & creative industries drive demand. |
| 📍 DIFC (Dubai International Financial Centre) | 20% | 💼 Premium financial hub — Highest quality leads, legal & financial firms, limited supply, premium lease rates. |
| 📍 Downtown Dubai | 11% | 🏙️ Prestige & visibility — Corporate HQs, luxury retail integration, stable demand from established brands. |
| 📍 Jumeirah Lakes Towers (JLT) | 10% | 🏢 SME & freelancer hub — Affordable strata offices, strong community infrastructure, high inquiry volume. |
| 📍 Barsha Heights (TECOM) | 8% | 📡 Media & tech cluster — Competitive rents, flexible licensing, growing startup and SME presence. |
| 📍 Dubai South | 7% | ✈️ Logistics & aviation corridor — Rising office interest due to Expo legacy, new inventory at Emaar Business Park. |
| 📍 Deira | 5% | 🏛️ Traditional commercial hub — Wholesale & trading firms, budget-friendly office options, stable lead volume. |
| 📍 Al Quoz | 4% | 🎨 Creative & industrial mix — Art galleries, design studios, SME offices, niche creative sector demand. |
| 📍 Other Areas (DIP, Al Qusais, Ras Al Khor, etc.) | 5% | 📍 Mixed business districts — Scattered office inquiries, value-for-money options, marginal lead share. |