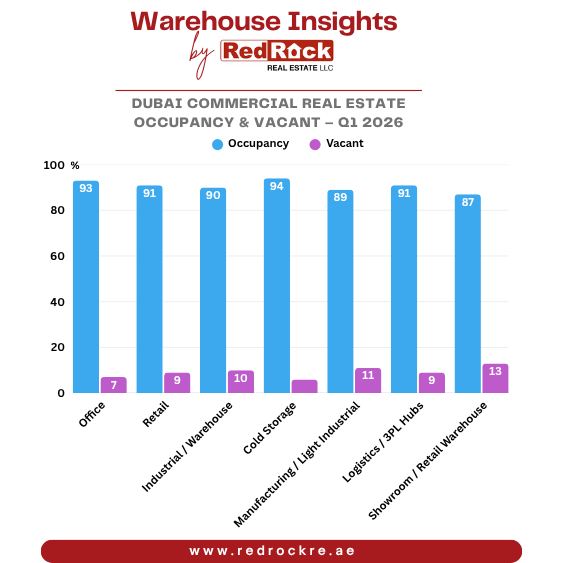
Occupancy & Vacancy rates — by key sector (estimates)
| Commercial Sector | Estimated Occupancy | Estimated Vacancy | Trend / Highlights |
|---|---|---|---|
| 🏢 Office (Prime / Grade A) | 93–95% | 5–7% | Very low supply DIFC, Downtown nearly saturated |
| 🛍️ Retail (Prime Malls) | 89–91% | 9–11% | Tourism-driven MOE, Dubai Mall occupancy ~95% |
| 🏭 Industrial / Warehouse | 90–92% | 8–10% | E‑commerce boost strong demand in Dubai South |
| ❄️ Cold Storage | 94–96% | 4–6% | Tightest market food/pharma & limited new supply |
| ⚙️ Manufacturing (Light Industrial) | 87–89% | 11–13% | Selective demand shift to high‑value production |
| 📦 Logistics / 3PL Hubs | 91–93% | 7–9% | Resilient growth JAFZA, Logistics Park near capacity |
| 🏬 Showroom / Retail Warehouse | 85–87% | 13–15% | Softer segment oversupply in Ras Al Khor / Al Quoz |